
Agent observability on the Claude Platform
This is a developer/platform-team tool: it lets teams building agents on Claude see exactly what each agent call did (latency, tokens, tool use) inside whatever monitoring tool they already use, which matters for tracking cost and reliability, not for a non-technical end user.
What changed
Source summary
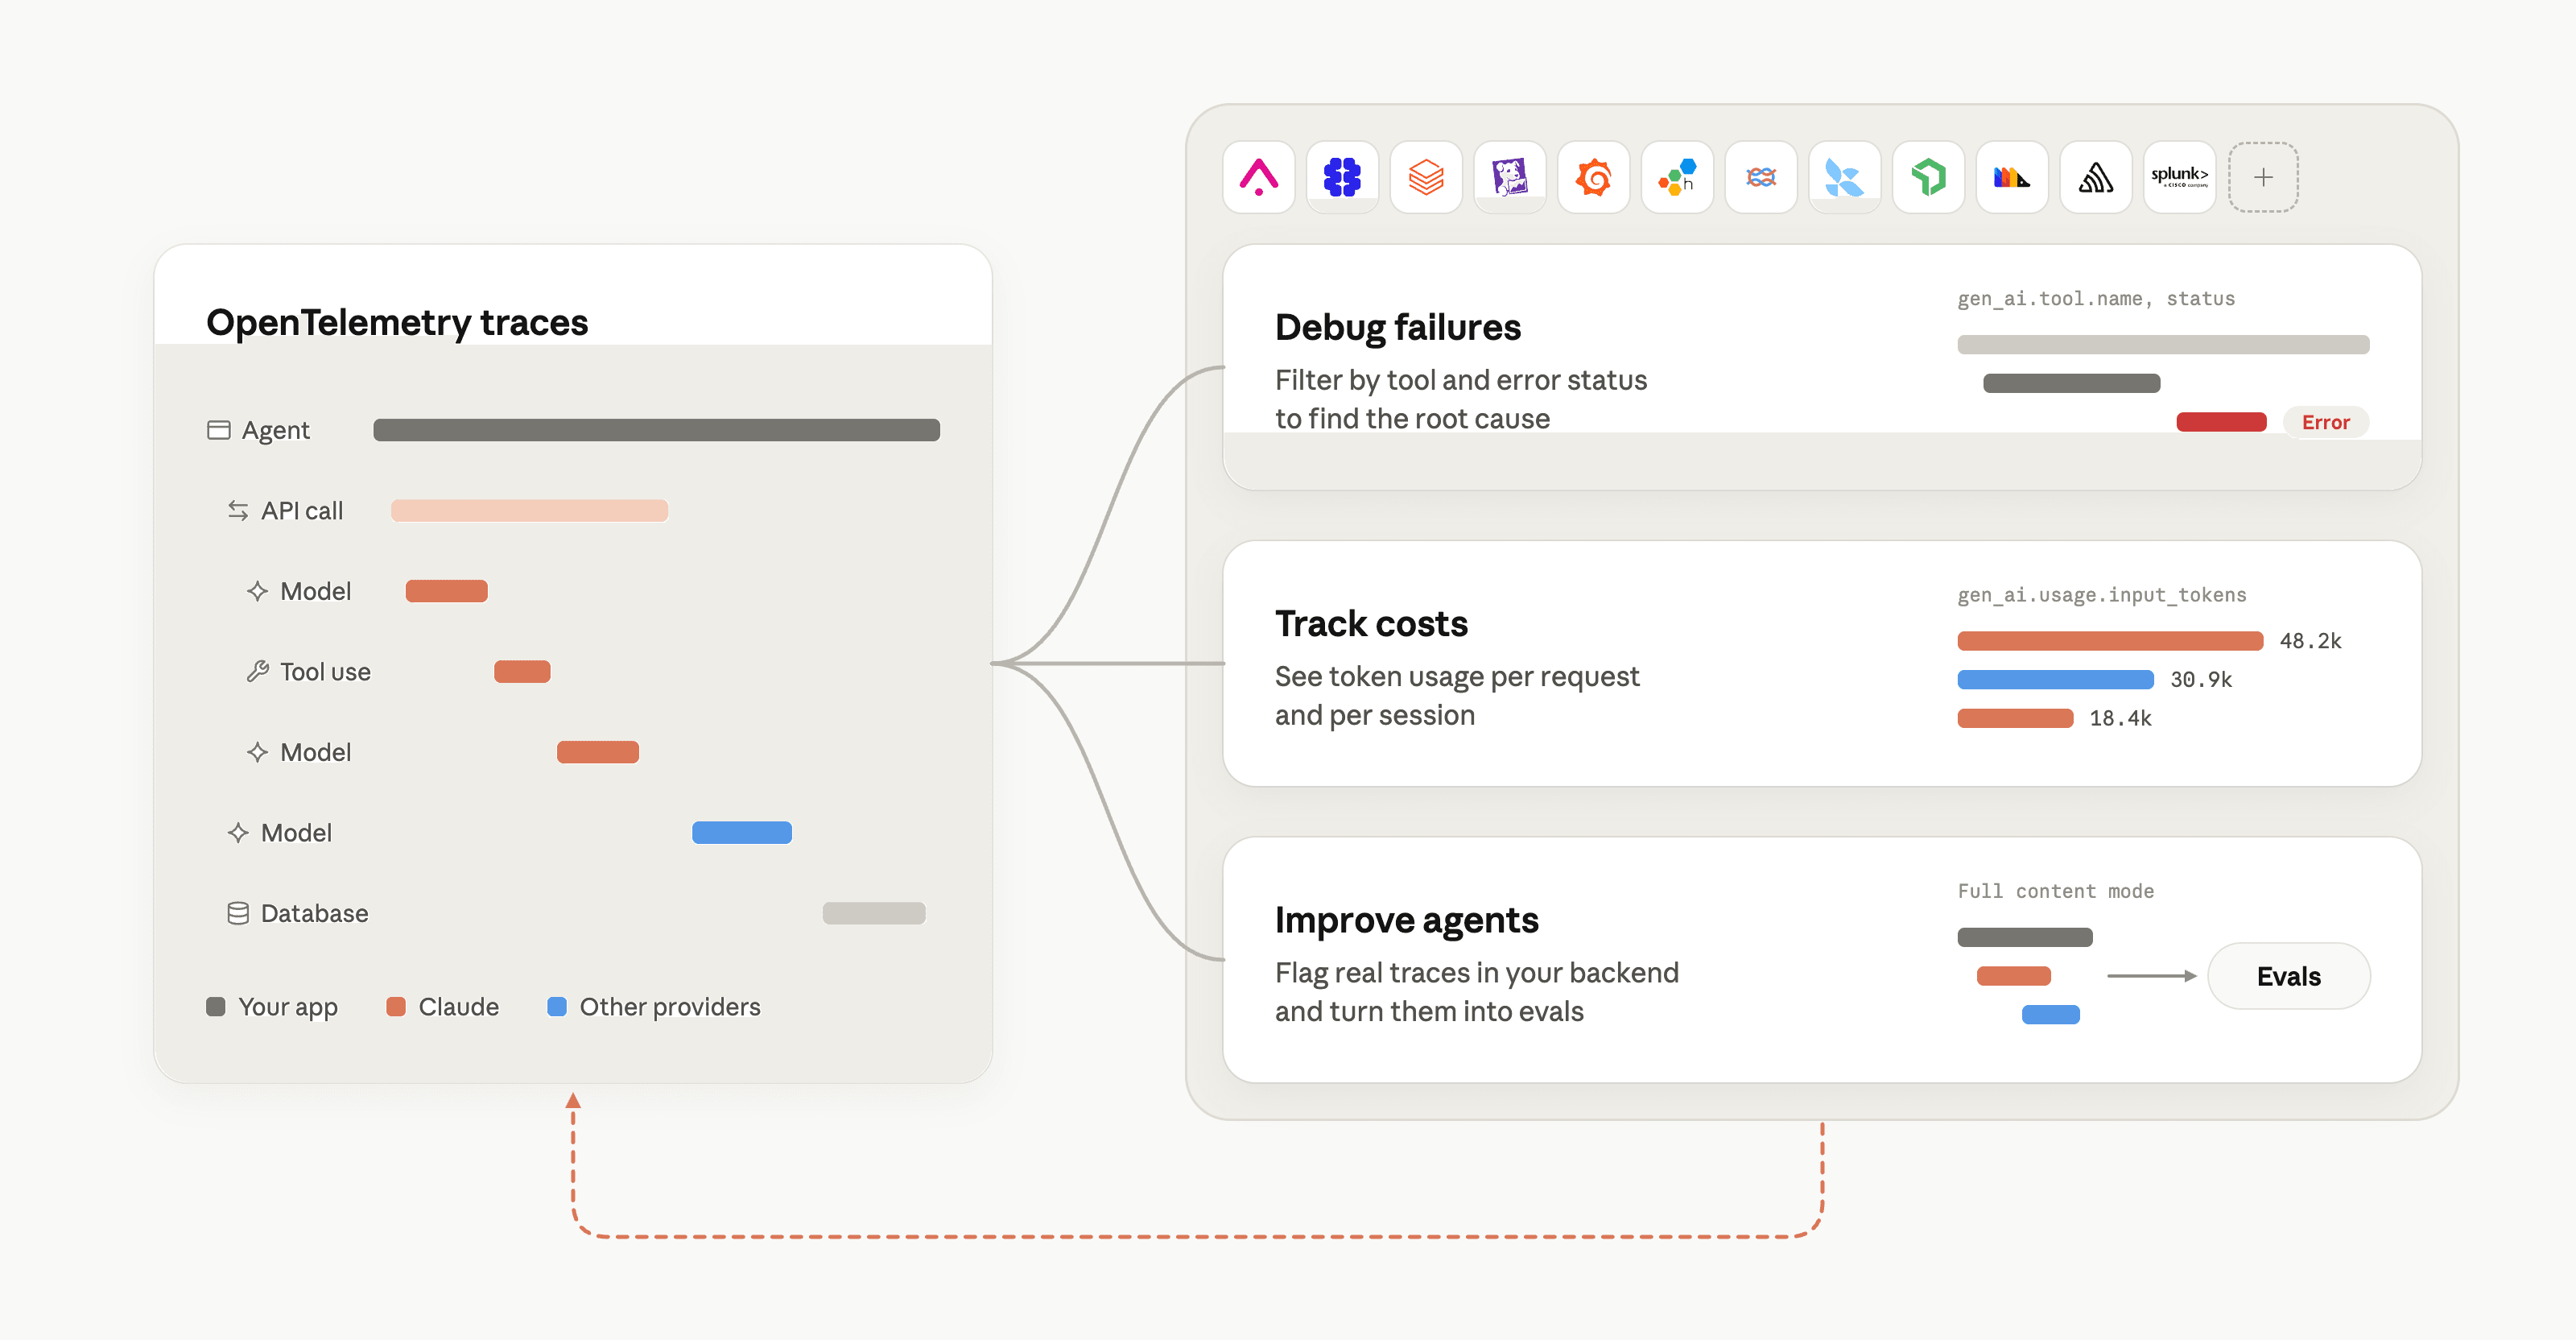
Anthropic added OpenTelemetry (OTel) tracing for Claude Managed Agents, the Messages API, and the Claude SDKs: each agent turn, model call, and tool use is exported as a trace with latency, token counts, and IDs, following OpenTelemetry's GenAI semantic conventions so it integrates with existing observability tools. It is in public beta on the Claude Platform; Managed Agents and the Messages API require adding a trace destination in the Claude Console, while the Claude SDKs export traces automatically.
Why it matters to your work
Practical interpretation
This is a developer/platform-team tool: it lets teams building agents on Claude see exactly what each agent call did (latency, tokens, tool use) inside whatever monitoring tool they already use, which matters for tracking cost and reliability, not for a non-technical end user.
When this could help
Relevant when you're running agents in production on the Claude Platform and need to debug performance or track token usage by team across an organisation.
Anthropic added OpenTelemetry (OTel) tracing so every agent turn, model call, and tool use exports a trace with latency, tokens, and IDs, following OTel's GenAI semantic conventions. Traces work with named partner tools (including Grafana Cloud, Honeycomb, Sentry, Splunk, Arize AI, Braintrust, Datadog, Langfuse, LangSmith, New Relic, PostHog, and Databricks Unity Gateway) and with any other OpenTelemetry tool that accepts a standard OTLP endpoint.
What to check
- Public beta; Managed Agents and Messages API tracing requires manual configuration of a trace destination in the Claude Console. Source ↗
Sources & provider guides
Official documentation checked 23 Oct 2026. SCALA prompts and workflows are suggestions, not claims of hands-on testing.
Source & availability
This is a summary of a published provider announcement, with practical context from SCALA’s feed.
Plan, region, workspace and rollout conditions may affect access in Australia. Check the original source for current availability.
claude.comThis update is primarily for technical teams.