
Build live dashboards and animate explainers with Claude
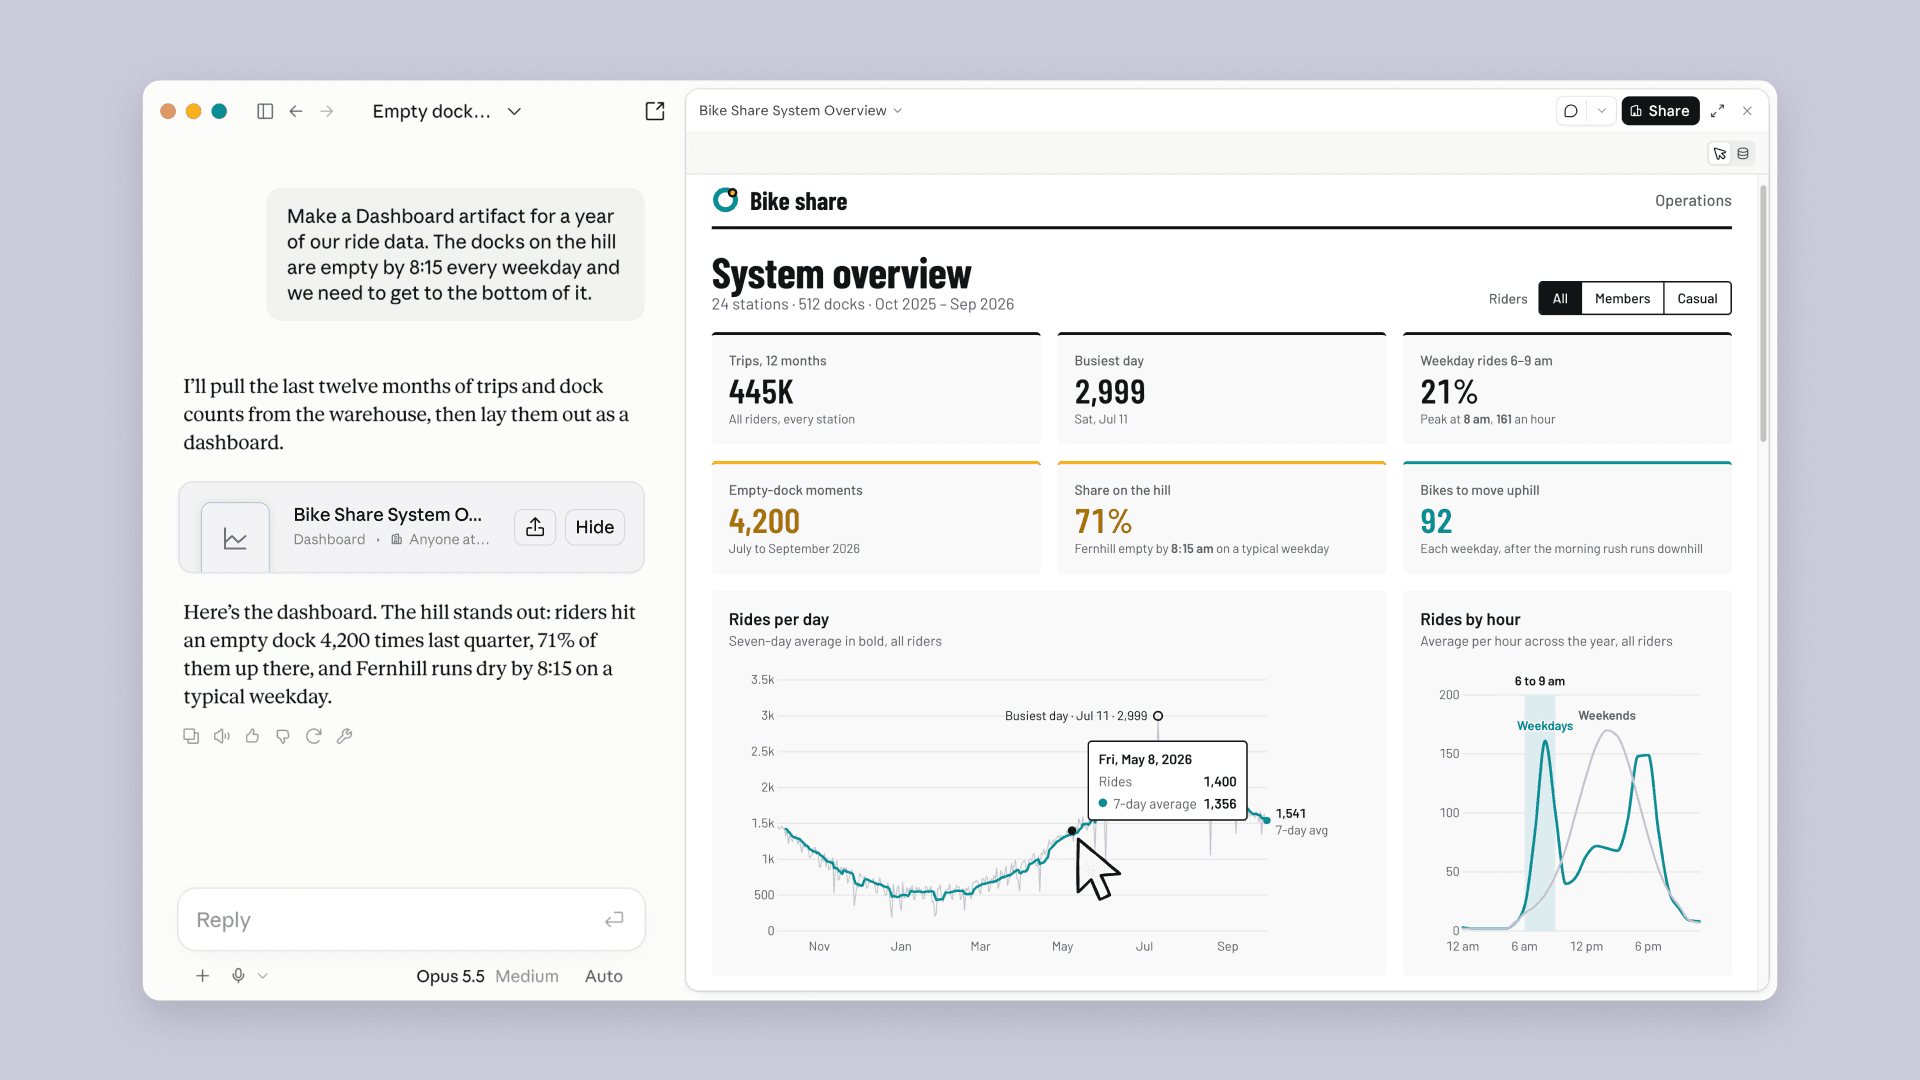
You can now ask Claude in plain language to build a live, auto-updating dashboard from your business data (beta, all paid plans), or turn a described process into an animated explainer video you can download (beta, Team and Enterprise). Both are useful for reporting or training content; on Enterprise plans, an admin needs to enable them first.
What changed
Source summary
Anthropic launched two new beta Claude features. Claude Dashboards lets you ask a plain-language question and have Claude build a live dashboard from connected data sources (e.g. Snowflake, BigQuery, Salesforce) that stays updated, with each number linked to its underlying query; sending dashboards to BI tools like Looker or Tableau is listed as coming soon. Claude Motion lets you describe an animated explainer and have Claude build it as editable code you can adjust and download as an MP4 — it does not use a video-generation model, so it produces no AI-generated footage or people. Separately, Docs, Slides, and Design features are leaving beta and becoming available on every plan including Free, admins can choose which artifact templates their organisation uses, and Artifacts now support customer-managed encryption keys. Dashboards is beta on paid plans; Motion is beta on Team and Enterprise plans; both are off by default for Enterprise and must be enabled in Organization settings > Artifacts. Docs/Slides/Design turn on by default from 15 October 2026, or sooner if an admin enables them. External sharing beyond an organisation depends on admin settings; no regional restrictions are stated.
Why it matters to your work
Practical interpretation
You can now ask Claude in plain language to build a live, auto-updating dashboard from your business data (beta, all paid plans), or turn a described process into an animated explainer video you can download (beta, Team and Enterprise). Both are useful for reporting or training content; on Enterprise plans, an admin needs to enable them first.
When this could help
A recurring data report (sales, operations, usage), or a one-off explainer video for training or stakeholder communication.
Claude can build a live, auto-updating dashboard from your connected data by describing what you want in plain language, or turn a described process into an editable, downloadable animated explainer.
How to get started
Enterprise admins: enable Dashboards and/or Motion in Organization settings > Artifacts.
Provider guidance ↗Connect your data source (e.g. Snowflake, BigQuery, Salesforce) if you have not already.
Provider guidance ↗Ask Claude your question in plain language to generate a dashboard, or describe the process you want animated to generate a Motion explainer.
Provider guidance ↗For Motion, adjust the result in the editor or through Claude, then download as MP4.
Provider guidance ↗
Try this · The SCALA method
Give AI a clearer brief
- Situation
- I manage a recurring reporting cycle and need to present metrics to stakeholders without building a full BI pipeline.
- Consultant
- A data analyst who can build and maintain live dashboards from connected data sources.
- Action
- Build a dashboard showing [metric] by [dimension] over the last quarter from [connected data source], and keep it updated. Link each number to its underlying query so I can verify the figures.
- Language
- A live dashboard with linked queries and refresh timestamps.
- Ask
- Which data source should I connect to, and which metric matters most for this reporting cycle?
SCALA suggested prompt · Adapt the context and check the result.
Learn the SCALA method →Build it into your routine
SCALA suggested workflow
Recurring report
At the start of each reporting cycle, open the same dashboard to see updated figures rather than rebuilding it from scratch.
Stakeholder explainer
When a process needs explaining to a new team, describe it to Motion and download the animated explainer as MP4.
What to check
- Claude Motion produces code-based animation, not AI-generated footage or people. Source ↗
- Sending dashboards to BI tools like Looker and Tableau is listed as coming soon, not yet available. Source ↗
- Whether a dashboard or explainer can be shared outside your organisation depends on your admin sharing settings. Source ↗
Sources & provider guides
Official documentation checked 12 Oct 2026. SCALA prompts and workflows are suggestions, not claims of hands-on testing.
Source & availability
This is a summary of a published provider announcement, with practical context from SCALA’s feed.
Plan, region, workspace and rollout conditions may affect access in Australia. Check the original source for current availability.
claude.com